Counties and states that voted for Trump are less educated and more likely to smoke, divorce, have teenage pregnancy, gonorrhea, and obesity
States that voted for Trump in 2024 tended to be less educated. The scatter plots below show this fact dramatically. Notice how the data slopes downwards to the right.
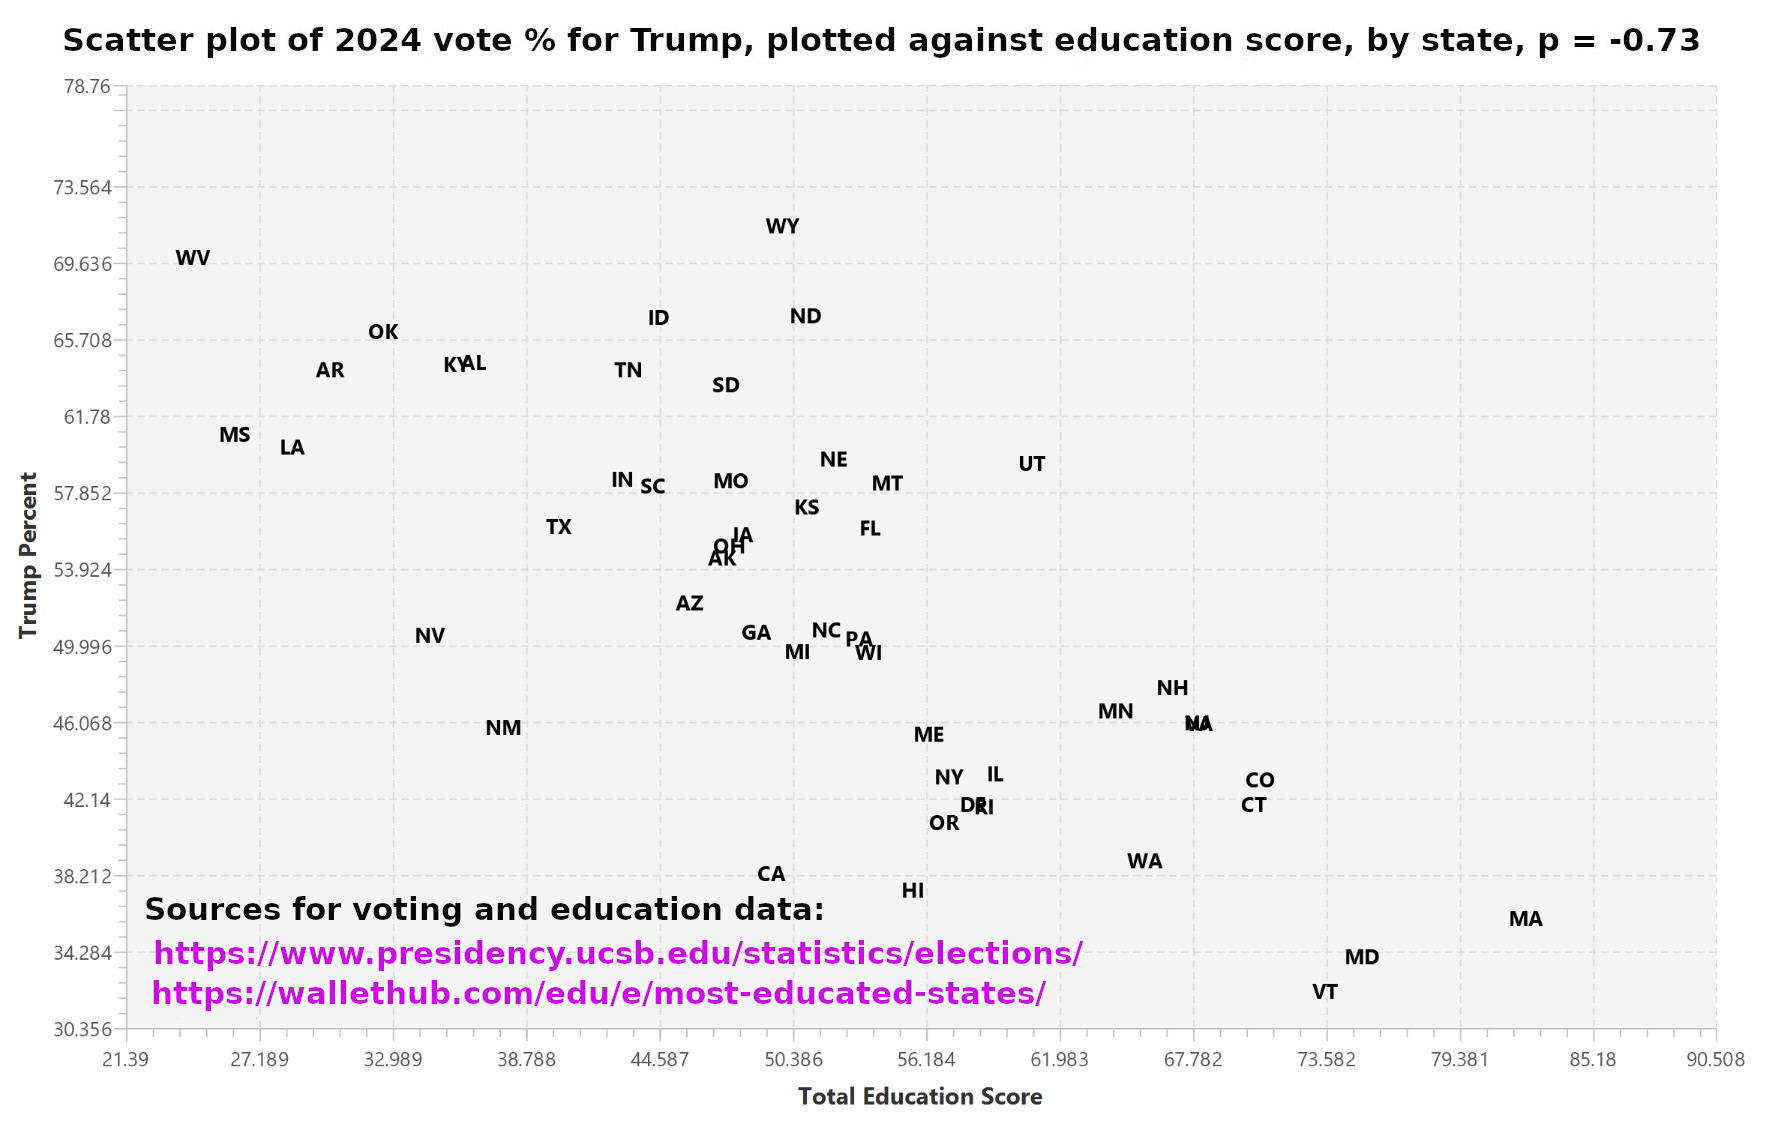
The most educated states — Massachusetts, Maryland, and Vermont — had the lowest percent of people voting for Trump in 2024. The least educate state, West Virginia, had the highest percent.
The sources for the data were: The American Presidency Project and Most & Least Educated States in America (2025).
The Pearson correlation coefficent -0.73 says that there is a substantial negative correlation between high education attainment of a state and the percent of voters who vote for Trump.
https://github.com/tonmcg/US_County_Level_Election_Results_08-24 has county-level election results, as well as county-level data about educational achievement. Using that data I made the following scatter char, which shows a p = 0.55 correlation between the percent of voters with a bachelors degree and the percent of voters who voted for Harris in 2024.
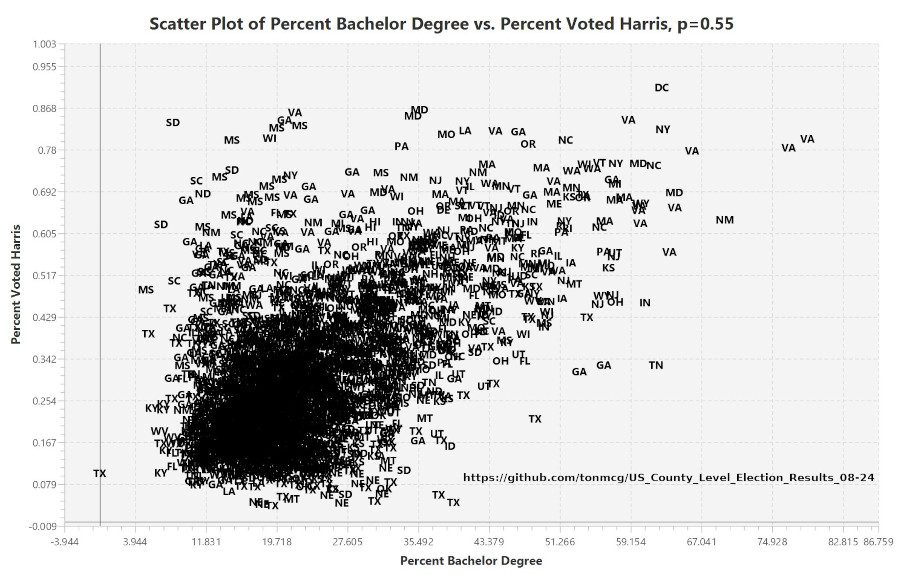
Note: a correlation of zero would mean no correlation. A correlation of +1 would mean perfect correlation. A correlation of -1 would mean perfect negative correlation. So p = 0.55 is significant.
As for what all this means — for example, were less educated voters more easily duped? — I’ll leave that open for discussion.
By the way, I did a similar analysis using crime data (both property and violent) from the FBI, per county. I compared the percent of votes for Trump to the rate of property crime, defined as the number of property crimes reported divided by the total number of votes cast. And a similar analysis for violent crime. For both property crime and violent crime, there was no significant correlation (Pearson correlation coefficient p = 0.05) between the the crime rate and Trump support. Likewise, I made a scatter chart of voting versus longevity, by county, and it showed a small (Pearson correlation coefficient p = 0.15) positive correlation between longevity and voting for Democrats.
ChatGPT said my results — for education, crime, and longevity — are consistent with others’ findings. “Crime is politically salient, but not a strong geographic predictor of partisan voting once you look at real data.” So, though crime is a hot-button topic, there are negligible differences between Democrat-voting and Republican-voting areas in overall crime stats. The small positive correlation with longevity is mostly because longevity is correlated with education, according to ChatGPT.
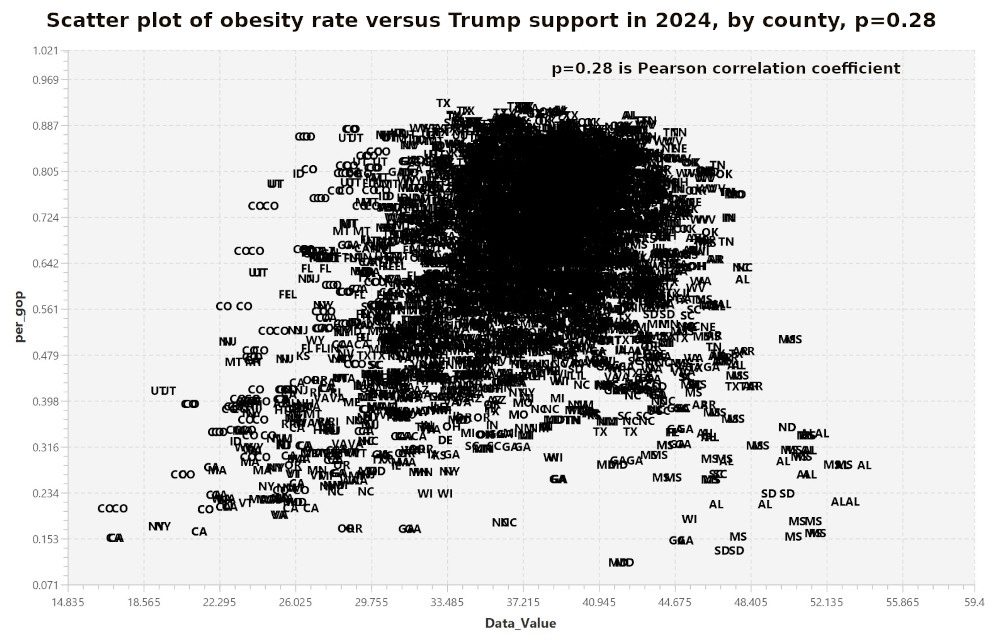
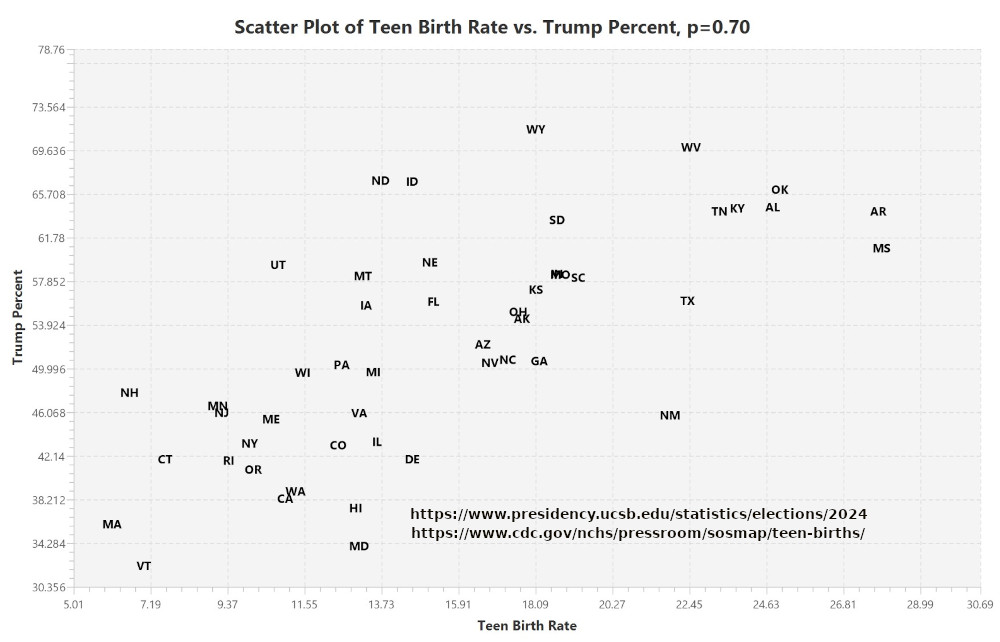
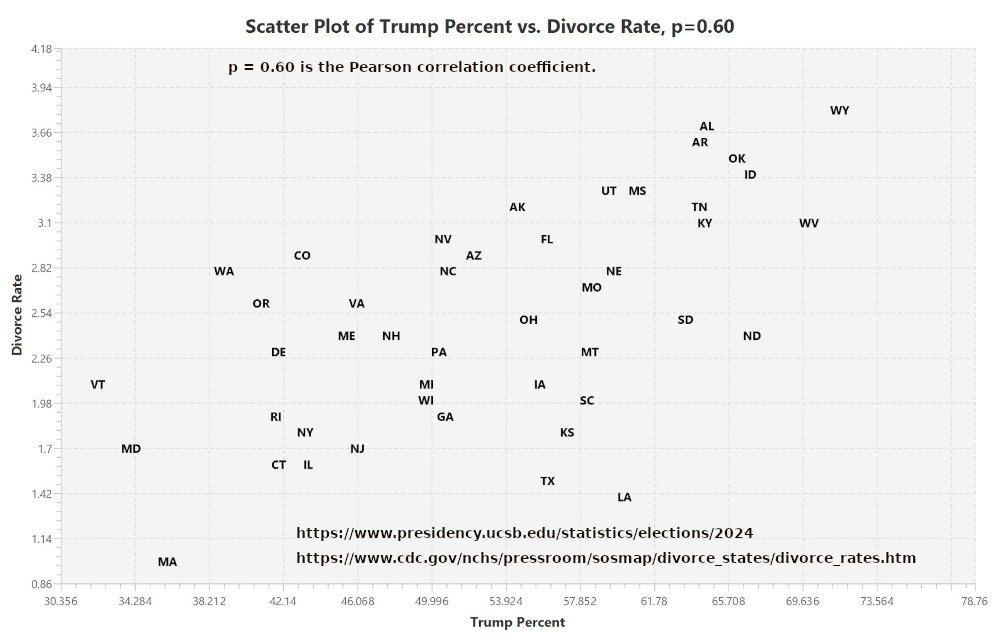
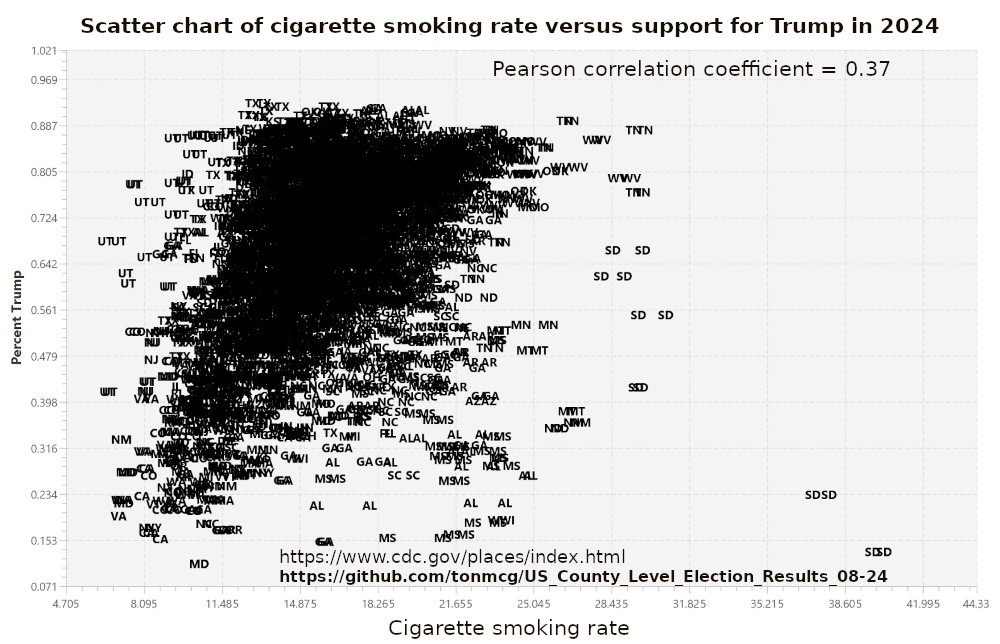
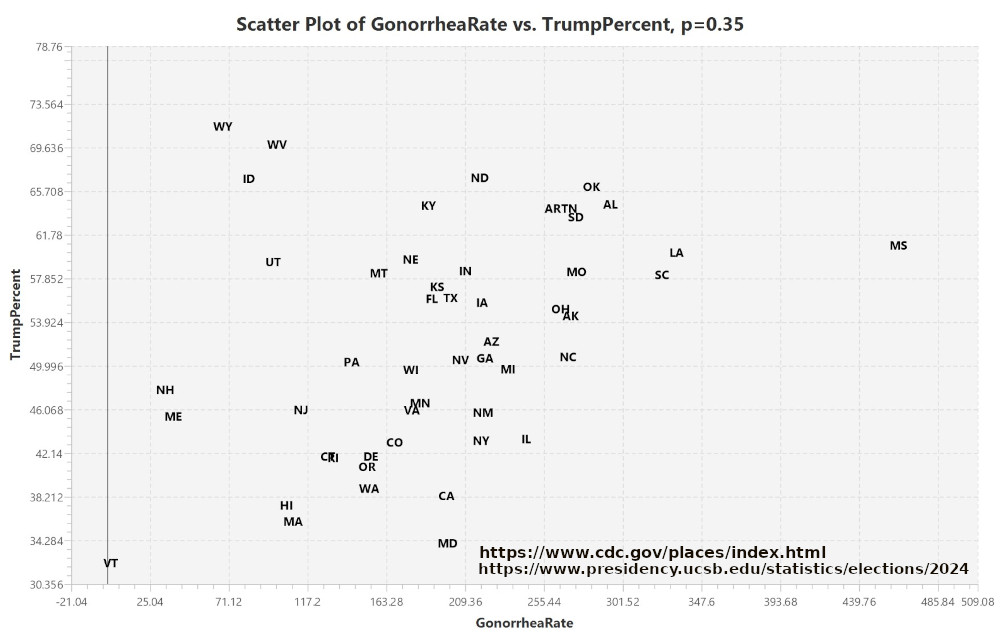
I did similar analyses for teen birth rate, cigarette smoking, divorce, gonorrhea, and obesity. (I got those rates from https://www.cdc.gov/places/index.html .) The correlations with Trump voting were 0.70 for teen birth, 0.60 for divorce rate, 0.37 for cigarette smoking rate, 0.35 for gonorrhea, and 0.28 for obesity.
The high correlation between teen births and Trump support makes sense, since Trump supporters are less educated, less likely to use birth control due to religious mores, and less likely to get an abortion. The high correlation with divorce is more surprising. But because sex out of marriage is frowned upon in conservative areas, people marry too young. And low education leads to economic precarity.
For syphilis the correlation was tiny (-0.05).