Washington State taxes have NOT increased relative to the GDP. And as a percent of GDP, WA is the 8th LEAST taxed state.
Republicans like to claim that Washington State taxes are too high. Especially on social media sites such as nextdoor.com, there are lots of posts comparing tax rates over the years and considering population growth and inflation. It’s a complex issue, and I don’t claim the analysis below is all-encompassing or the final word.
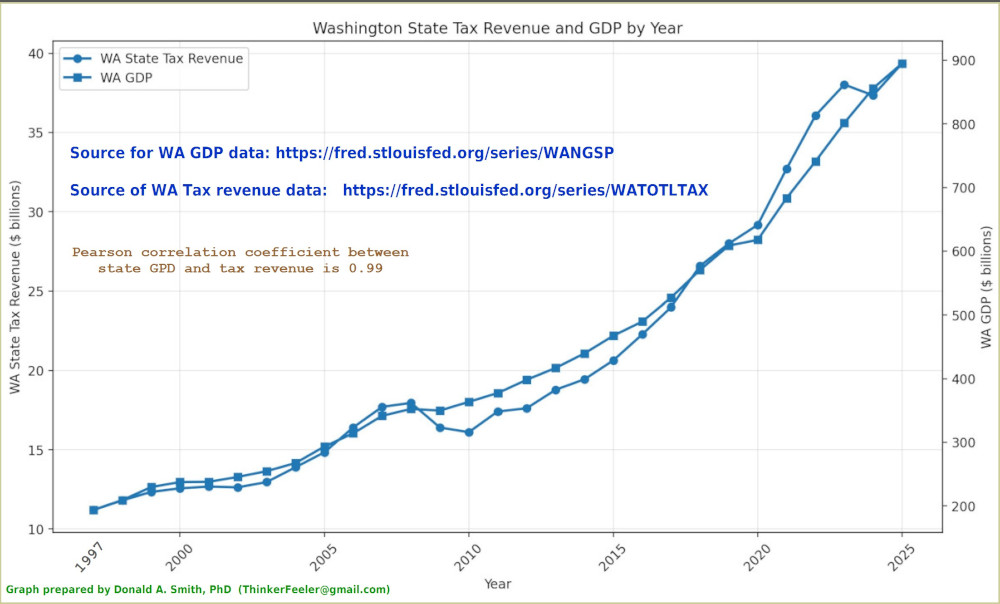
Using data provided by the St. Louis Federal Reserve, I made the graph below plotting Washington State tax revenue and Washington State’s GDP on the same graph.
What the graph shows is that, contrary to Republicans’ claims, Washington State tax revenues have not increased any more than GDP has. Throughout this time period, state tax revenue has been about 4.4% of GDP. The Pearson correlation coefficient between taxes and GDP is 0.99, and you can see from the graph below that the data lie almost along a straight line. (From about 2009 through about 2016, tax revenue lagged GDP by a bit — due to the Bush recession? — while from 2020 until 2024, tax revenues exceeded GDP by a bit.)
The source for the GDP data was: https://fred.stlouisfed.org/series/WANGSP .
The source for the tax revenue data was: https://fred.stlouisfed.org/series/WATOTLTAX .
This analysis supplements the argument made in the following useful essay but was developed independently: Washington State’s budget has been shrinking, not growing, despite statements to the contrary by former elected officials. Quoting: “In 2005, when Gregoire took office, expenditures per $1,000 in personal income were $189.98. And in 2023, which is now the most recent year for which data is available, they were $170.25. That’s not growth. That’s shrinkage.”
The csv file from which the above graph was generated is here: taxes-versus-GDP-WA-from-1997.csv.
Washington state is the 8th least taxed state, as a percent of GDP
The Department of Revenue has a webpage Comparative state and local taxes has chart about taxation, comparing taxes in Washington with other states.
In the drop-down on that page if you choose “State and Local Taxes as % GDP” you can see that by that measure, Washington is the 8th least taxed state.
It makes sense: wealthier, productive states will pay more in taxes in absolute terms. But in relative terms, we pay little.
And if you choose “State and Local Taxes per $1,000 Personal Income” you’ll see that by that measure Washington is the 23rd least taxed state.
But, yes, you can lie with statistics, and the practical meaning of all this is difficult to gauge. Who pays the taxes? Who earns the income? Who benefits from the state spending that taxes enable? How well is the tax money spent? In addition to considering the absolute amount of tax, you have to consider income: if your income is higher, of course you can afford more taxes. Indeed, high-taxed states tend to have high incomes per capita.
For a different perspective, consider the Tax Foundation’s 2026 State Tax Competitiveness Index. In 2026 Washington State ranked as the
2nd highest sales tax (49 out of 50), after Louisiana
4th highest corporate tax
26th highest property tax
31st highest individual income tax. There’s no state income tax, so they must have considered the capital gains tax. Possibly the estate tax.
The fact that there’s no state income tax but the overall rank and sales tax rank are high shows how regressive Washington State’s tax system is.
Source: https://taxfoundation.org/statetaxindex/. Note: in their table, a rank of 50 means the most taxed. So I subtracted from 50 and added 1 (since ranks start at 1, not 0).
By the way, according to a google search: Gross Domestic Product (GDP) includes some government spending. In the standard expenditure approach, GDP is calculated using the formula
$GDP = C + I + G + (X – M)$.
- Salaries of public workers
- National defense and military equipment
- Infrastructure like new schools, highways, and bridges
Only the government’s purchases of goods and services produced in the economy count toward GDP. A large portion of government spending goes toward transfer payments—such as Social Security, unemployment benefits, and veteran’s benefits. These are not counted in GDP because the government does not receive a new good or service in return for them; they are simply transfers of income.
- Personal Consumption Expenditures (C): The vast majority of Medicare spending is classified as “Government Social Benefits to Persons.” When Medicare pays a private hospital or doctor for a beneficiary’s treatment, it is counted as a household consumer health expense.
- Government Consumption (G): The smaller portion of Medicare funding used strictly to manage the program—such as administrative costs, processing fees, and running the federal offices—is counted directly as government spending.