Washington State is the 8th LEAST taxed state, as a percent of GDP
The Department of Revenue has a webpage Comparative state and local taxes has tax charts comparing Washington with other states.
In the drop-down on that page if you choose “State and Local Taxes as % GDP” you can see that by that measure, Washington is the 8th least taxed state. The data is for fiscal year 2022.
For data up to 2025, Economic Opportunity Institute says “Relative to income and population growth, Washington’s budget has actually declined by 60% overall. From 1995 to 2025, the state’s yearly operating budget shrank from 1.55% to 0.63% of total personal income for every one million residents (adjusted for inflation.”
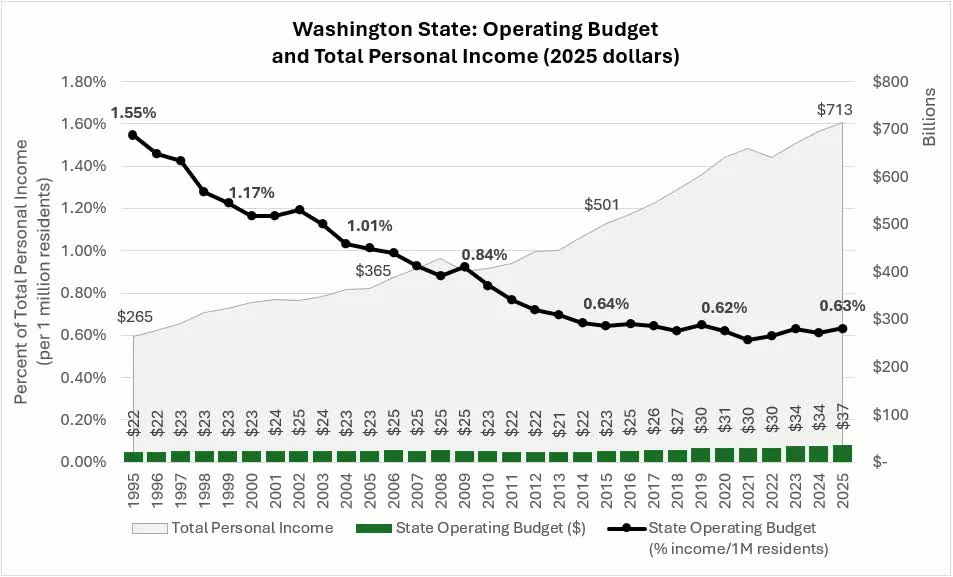
It makes sense: wealthier, productive states will pay more in taxes in absolute terms, even per capita. But relative to the GDP, we pay little in Washington State.
And if, from the state DOR website, you choose “State and Local Taxes per $1,000 Personal Income” you’ll see that by that measure Washington is the 23rd least taxed state.
But, yes, you can lie with statistics, and the practical meaning of all this is difficult to gauge. Who pays the taxes? Who earns the income? Who benefits from the state spending that taxes enable? How well is the tax money spent?
For a different perspective, consider the Tax Foundation’s 2026 State Tax Competitiveness Index. In 2026 Washington State ranked as the
2nd highest sales tax (49 out of 50), after Louisiana
4th highest corporate tax
26th highest property tax
31st highest individual income tax. There’s no state income tax, so they must have considered the capital gains tax. Possibly the estate tax.
The fact that there’s no state income tax but the overall rank and sales tax rank are high shows how regressive Washington State’s tax system is.
In addition to considering the amount of tax, you have to consider income: if your income is higher, of course you can afford more taxes. Indeed, high-taxed states tend to have high incomes per capita.
Source: https://taxfoundation.org/statetaxindex/. Note: in their table, a rank of 50 means the most taxed. So I subtracted from 50 and added 1 (since ranks start at 1, not 0). Also, their calculations are complex and consider over 150 variables.
The Tax Foundation is Republican-aligned and generally anti-tax, so regard their findings with skepticism.