Why Washington State has the Highest Class Sizes in the Nation
According to a January 2015 study of tax rates in all 50 states by the Institute on Taxation and Economic Policy, called “Who Pays”, Washington families pay among the highest state taxes in the nation – 20% above the national average. Washington families should therefore have the best funded schools and lowest class sizes in the nation. Instead, Washington’s one million children are forced to endure the highest class sizes in the nation. How can this be? In this report, we will “follow the money” to see how the Washington state legislature is robbing our schools of billions of dollars and robbing our children of their future in order to line the pockets of a few billionaires and wealthy multinational corporations.
Why Small Class Sizes are Important
Small class sizes matter to the future of our students because small class sizes allow struggling students to get the help they need to succeed in school and succeed in life. For example, the nation’s largest study on class sizes found thatlow income students who were lucky enough to have four full years of smaller classes were much more likely to graduate than their peers who only had zero to one year in smaller class sizes:
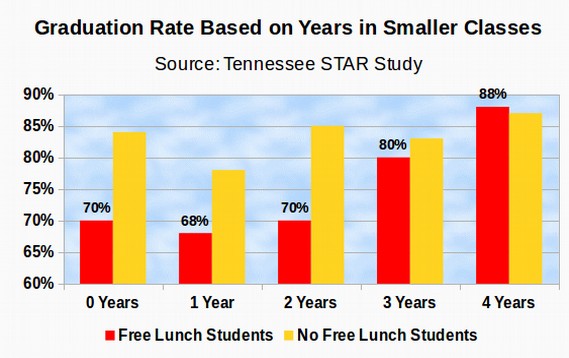
Source: Finn, J. D., et. al. (2005). Small Classes in the Early Grades, Academic Achievement, and Graduating From High School. Journal of Educational Psychology.
http://www.classsizematters.org/wp-content/uploads/2012/10/Small-Classes-in-the-Early-Grades-Academic-Achievement-and-Graduating-From-High-School.pdf
A 2011 study, summarizing the life academic and economic outcomes of students in smaller classes in the STAR study compared to their peers who had normal class sizes, found that “The effects of class quality fade out on test scores in later grades but gains in non-cognitive measures persist.†Put in plain English, high stakes test scores are not an accurate predictor of future student performance. However, student engagement from small class sizes is predictive of future success as an adult.
Here are just some of the adult outcomes for these students 20 years later of being in a smaller class in elementary school: Students were significantly more likely to graduate from high school, attend college, start a savings account, buy a home, get married and stay married. Students were less likely to commit a crime or go to prison. Much of this information was obtained from federal tax returns of 95% of the nearly 12,000 students involved in the STAR study.
Source: Chetty, R., Friedman, J.N., Hilger, N., Saez, E., Schanzenbach, D.W., & Yagan D. (2011). How does your kindergarten classroom affect your earnings? Evidence from Project STAR. Quarterly Journal of Economics, 126(4), 1593-1660.
http://obs.rc.fas.harvard.edu/chetty/STAR.pdf
In a separate analysis, Alan Krueger, Chair of the Council of Economic Advisers, estimated that every dollar invested in reducing class sizes yielded about $2 in long term economic benefits. https://etec511.wikispaces.com/file/view/economic+considerations+and+class+size.pdf
Smaller Classes Lead to More Successful Students
Wealthy private schools understand the importance of small class size. For example, at Lakeside Private School in Seattle, average class sizes are 16 students. If class sizes of 16 students is considered ideal for the children of the wealthy, small class sizes of 16 students should be available to all students in Washington state.

Sadly, Washington has the Highest Class Sizes in the Nation
Unfortunately, according to the National Center for Education Statistics Schools and Staffing Survey (Table 8), Washington State has the third highest class sizes in the nation for elementary school, the second highest class sizes in the nation for middle school and the second highest class sizes in the nation for high school. http://nces.ed.gov/surveys/sass/tables/sass1112_2013314_t1s_007.asp
This estimate of class sizes comes from a national survey of classroom teachers in which teachers are asked how many students are in their average classroom. This survey indicates that for Grades 1 through 6, the national average class size is 21 students and the average class size in Washington state is 24 students. For Grades 7 through 12, the national average class size is 27 students and the average class size in Washington state is 30 students.http://nces.ed.gov/programs/digest/d13/tables/dt13_209.30.asp
Here is a distribution of class sizes showing which states have low, average, above average or extremely high class sizes:
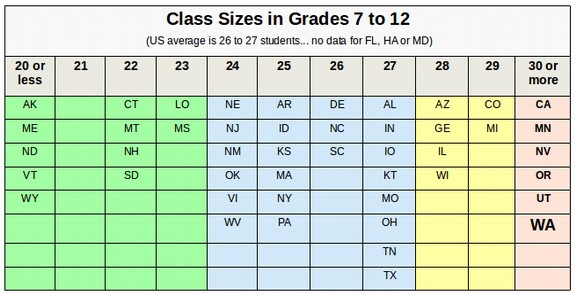
However, even this survey of teachers under-reports the actual class sizes in the nation and in Washington state because it includes Special Education teachers who often have classes of under 10 students. Excluding Special Education classes, the typical or median class size in the US is likely close to 29 students and in Washington state, the typical or median class size is close to 32 students per teacher per class period.
Why Actual Class Sizes are Much Larger Than Student to Teacher Ratios
The most common mistake made when discussing class size is to confuse class sizes with Student to Teacher Ratios. The Student to Teacher Ratio is determined by dividing the total number of students in a school or a state by the total number of professional staff at the school or the state. For example, if you go to the Washington State OSPI website and click on Apportionment, then Publications, then Personnel Summary Reports, then select a year, then click on Table 46, you will get a report called “Ratio of Students to Classrooms.†This is actually the Student to Teacher Ratio. For the 2014 school year, this ratio was 18.2 students per teacher. http://k12.wa.us/safs/PUB/PER/1415/tbl46.pdf
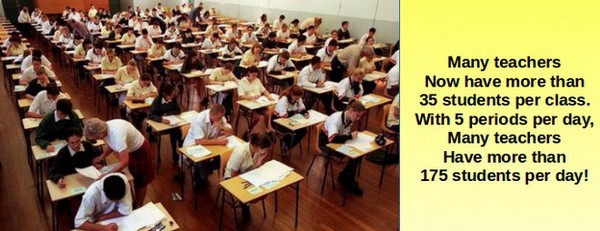
This type of statistic might mislead one into believing that the class sizes in Washington state are only 18 students – which would mean Washington state has the lowest class sizes in the nation and in the world. Yet if you walk into any real classroom at any real school in Washington state and count the actual students, you will see about 30 students in the real classroom. Many classrooms have 35 to even 40 students!
The OSPI state report card is also misleading. It indicates that Washington state has 1,075,107 students and 60,543 Classroom Teachers. This would lead one to believe that the average class size is 18 students in our state. Why is there such a huge difference between the Student to Teacher ratio reported by OSPI and the number of students in real classrooms? The problem is that OSPI uses an extremely broad definition for classroom teacher. Many so-called classroom teachers are actually administrators. We need administrators. But we should not be misleading parents and voters by calling them teachers. Using Student to Teacher ratios misleads the public and even legislators into thinking that class sizes are not that bad when the truth is that class sizes in Washington state are among the highest in the nation.
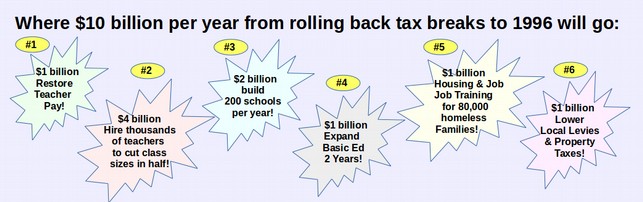
In fact, using a real average class size of 30 students, the actual number of classroom teachers we have is about 36,000. This means that OSPI is mis-reporting 24,000 administrators as teachers. This also means that at 10,000 additional teachers per billion dollars, it would take about $3.6 billion dollars per year to cut class sizes in half here in Washington state. This does not include the cost of support staff or building the actual schools. Nor does it include raising the pay of teachers here in Washington state to the West Coast average or eliminating the use of local levy funds for basic education. My plan to cut class sizes in half therefore includes one billion dollars for replacing levy funds, one billion for increasing teacher pay, two billion for building hundreds of new schools every year, and four billion for hiring 36,000 new teachers and 4,000 additional support staff. The total needed to cut class sizes in half is about $8 billion in additional revenue per year.
Where can we get $8 billion per year needed to cut class sizes in Washington state in half?
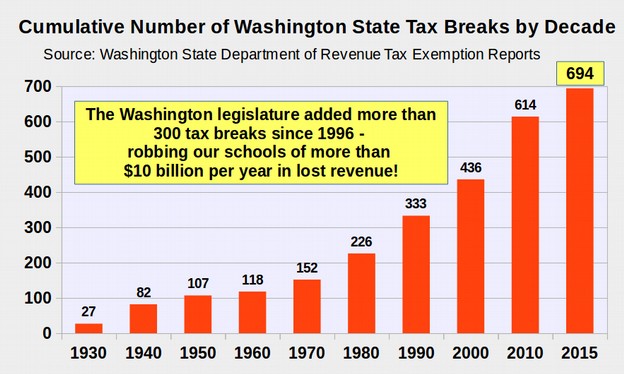
Given the fact that poor and middle class families in Washington state are already paying the highest state taxes in the nation, a more accurate question is where are the money went that should have gone to our public schools? It turns out that there is no need to increase taxes at all. What we really need to do is decrease tax breaks for the wealthy. It will be impossible to lower class sizes for struggling students until we first recognize and better understand how Washington legislators real Paramount Duty has not been our public schools but rather giving away more than $30 billion in tax breaks to wealthy multinational corporations (who pay for their re-elections). Here is a graph of the increase in the number of state tax breaks since 1996:
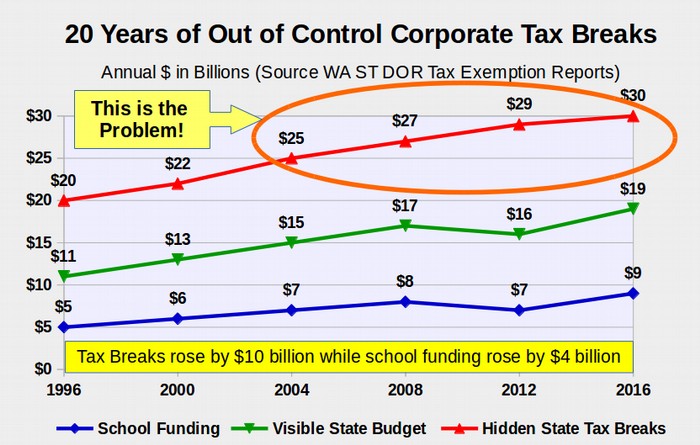
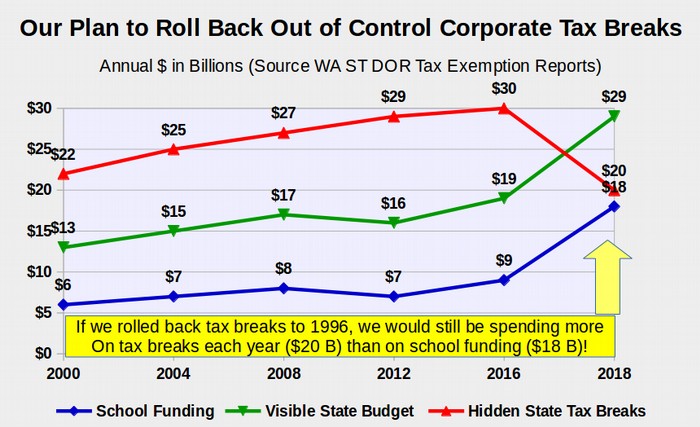
Here is a graph of the increase in the dollar amount of the tax breaks in billions of dollars compared to total state revenue and spending for public schools:
Understanding the Deceptive Nature of the Washington Department of Revenue Tax Break Reports
The Washington legislature has not only approved the largest tax breaks in the US, they have approved the largest most unsustainable tax breaks in the history of the world. This is why we now have such a broken tax system.
Since tax breaks for the wealthy are what prevent us from fully funding schools, any parent or teacher who wants to understand why Washington has the highest class sizes in the nation must take time to understand how the public is being deceived about the amount of these state tax breaks. This subject is complex. So try to be patient, take your time and read slowly.
Every four years since 1984, the Washington State Department of Revenue is required by law to release a Tax Exemption Report. Here is a quote from RCW 43.06.400 authorizing this report: “Beginning in January 1984, and in January of every fourth year thereafter, the department of revenue must submit to the legislature prior to the regular session a listing of the amount of reduction for the current and next biennium in the revenues of the state or the revenues of local government collected by the state as a result of tax exemptions. The listing must include an estimate of the revenue lost from the tax exemption, the purpose of the tax exemption, the persons, organizations, or parts of the population which benefit from the tax exemption, and whether or not the tax exemption conflicts with another state program.“
It should be obvious that giving away tens of billions of dollars in tax breaks every year conflicts with the Paramount Duty of the legislature to fully fund our public schools. Every billion dollars of tax exemptions means 10,000 more teachers losing their jobs and thousands of kids forced to endure higher class sizes. This fact is not mentioned on any of the tax break reports.
In January 2016, Vikki Smith, the current Director of the Washington State Department of Revenue released the 2016 Tax Exemption Report, which she called the 2016 Tax Exemption Study. I have spent more than 8 years researching and writing analysis of the previous four versions of this report and I will briefly summarize my findings here You can download a PDF file of this 910 page study at the following link:
http://dor.wa.gov/docs/reports/2016/Tax_Exemption_Study_2016/2016_Tax_Exemption_Study_Entire_Report.pdf
The Department of Revenue currently collects about $20 billion per year in taxes but also exempts at least $30 billion per year in state taxes. The DOR Tax Exemption Study attempts to describe the $30 billion per year in lost state revenue. These $30 billion in lost state revenue are “justified” by corrupt state legislators with the false claim that they “create jobs.” In fact, history shows that in nearly every case, tax exemptions to wealthy multinational corporations like Microsoft and Boeing do not create jobs. For example, after receiving billions in tax breaks, Boeing has laid off thousands of workers and used their tax breaks to build a non-union airplane manufacturing plant in South Carolina – firing thousands of Washington workers. Microsoft used their tax breaks to build sweat shops in China – also firing thousands of Washington workers.
However, as was true of the 2012 Report, authored by the former director of the Department of Revenue, Suzan Delbene, the 2016 report has several glaring omissions:
First, the 2016 study does not include the 1997 tax break on commercial intangible property. Since this is one of the largest of all the tax breaks accounting for several billion dollars in lost revenue with these benefits going almost entirely to three of the the richest people in the world, Bill Gates, Steve Ballmer and Paul Allen, one has to question the validity of the rest of the 2016 Tax Exemption Study.
Second, this report does not mention the billion dollar per year Microsoft Business and Occupation tax break. Microsoft achieves this tax break by claiming that they are located in Nevada – when everyone including the Washington State Department of Revenue knows they are located in Redmond Washington.
Third, this report does not fully analyze revenue lost by manipulating the Business and Occupational categories that alway some businesses to pay these taxes at an extremely low rate while other businesses pay these taxes at an extremely high rate. It simply assumes the previous manipulated B & O rate was somehow fair or accurate. A more consistent way to evaluate any tax would be against a set standards such as a one percent B & O tax.
Fourth, this report low balls the amount of revenue lost through tax breaks by falsely claims that repealing all 694 tax breaks (now up to more than 700 thanks to the 2016 legislature) would only generate about $30 billion. This claim is based on another blatantly false assumption that repealing the 1931 intangible property tax break on personal property would not generate more revenue but merely shift the burden of total property taxes away from some tax payers and to other tax payers. Here is a quote from Section 1, page 3 of the study: “Repealing a property tax exemption does not increase state revenues. Removing a property tax exemption broadens the tax base, and at the same time reduces the tax rates. This reduces the property taxes for existing taxpayers, and shifts property tax to currently exempt taxpayers.”
In fact, our state constitution has a one percent tax rate on all property. If you own a $200,000 home, one percent of that is $2,000 in property taxes. But if the value of your home doubles to $400,000, then one percent of that is $4,000. The state revenue is directly related to the value of property. So if the value of property doubles, the tax burden is not merely shifted from one tax payer to another – the total state and local taxes available doubles. How Vikki gets away with such an absurd statement is because local levy rates are set by the total amount of the levy and if the total amount did not raise then the burden would just shift from one property owner to another. What Vikki is ignoring is that the total levy is almost always limited by the one percent limit rule in our state constitution. Doubling the amount of property would double the revenue available for funding public schools.
Vikki next mistakenly assumes that the value of intangible property is only $2 trillion. Intangible personal property is discussed on page 17-458 of the 2016 tax exemption report. On page 459, Vikki states that her assumption is that the value of personal intangible property exempted is $1,907 billion or about $2 trillion or about the same as the value of tangible property in Washington state. The ratio of tangible to intangible property was 50-50 in the 1990s. But there has been a dramatic rise in the value of intangible property to the point where by 2010, intangible property accounted for about two thirds of all property. In other words, since we know that tangible property in our state
What is Intangible Property?
Tangible property is property you can touch –such as homes and commercial buildings. Intangible property includes all other forms of wealth – such as stocks, bonds and computer programs. Historically, intangible property accounted for a very small percent of all property. However, with the concentration of wealth in the hands of the very rich, intangible property now account for over 70% of all property. Over 90% of intangible wealth is owned by the top one percent of our richest citizens.
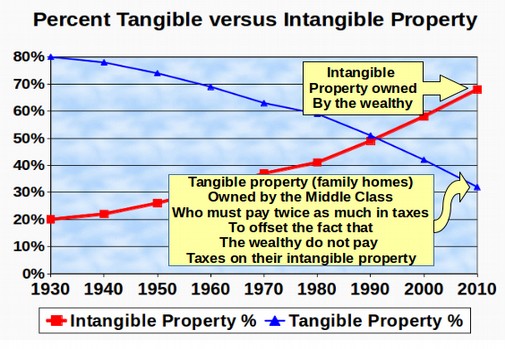
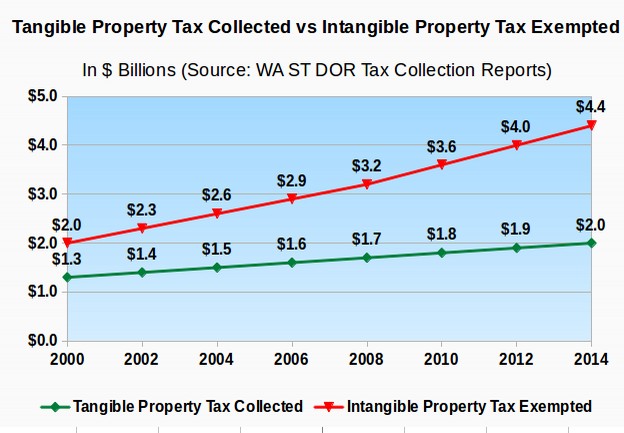
Due to a rapid rise in the concentration of wealth in the hands of the richest one percent, and with nearly all of this wealth being in the form of intangible property, the amount of lost revenue due to this tax exemption has skyrocketed since 1997 to the point where it is now causing a loss of state funding of more than $4 billion per year.
It is no mere coincidence that our State has been short changing our public schools by billions of dollars a year ever since. As a direct result of this massive and unwise State tax give away, as well as the federal tax cuts since then, the wealth of the richest one percent of our population has DOUBLED in the past 20 years from 20% of our total wealth to 40% of our total wealth. This single exemption was responsible for $7 billion in state tax breaks per biennium or $3.5 billion in state tax breaks per year in 2008. This makes this single tax break much larger than any other tax break. The law allowing for this tax break is RCW 84.36.070. http://apps.leg.wa.gov/rcw/default.aspx?cite=84.36.070
This massive 1997 tax loop hole has given billions of dollars in tax breaks to our richest citizens every year during the past 18 years by exempting over one trillion dollars of “intangible property†from our State property tax. It is the single largest tax break in the history of our state and bigger than the Billion Dollar Per Year Boeing Tax Break and the Billion Dollar Per Year Microsoft Tax Break combined!
A Billion Dollar Shift in Property Tax Burden from Investors to Homeowners
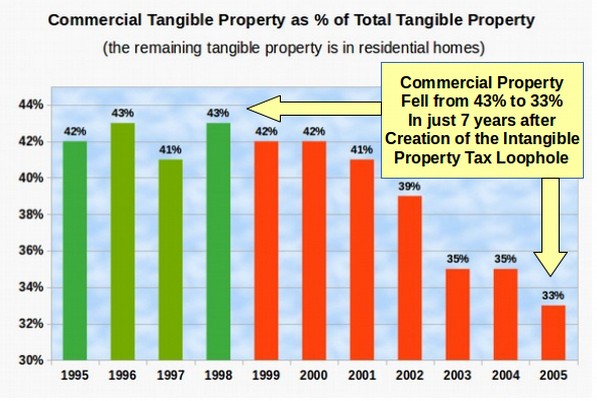
One mechanism that led to this loss of state revenue was that wealthyinvestors suddenly had a huge financial incentive to mis-classify their commercial tangible property as intangible property. This is what many investors did – causing a huge shift in property tax burden from investors to homeowners. Here is a graph of this shift:
Source: Washington State Department of Revenue http://dor.wa.gov/docs/reports/wa_tax_system_11_17_2004.pdf
The property tax burden on middle class homeowners has skyrocketed in the past 14 years as the ratio of commercial to residential tangible property has shifted from about 50-50 in 1997 to 66% residential to 33% commercial by 2006. When $100 billion dollars of commercial property is exempted from property taxes, residential property taxes must go up even if State and local spending remains the same.
As a consequence of these tax break for millionaires, and tax shifts to our middle class, our middle class now pay much more than the national average in State taxes while millionaires in our State pay much less than the national average. Working families see their tax bills go through the roof and they naturally assume that State spending is “Out of control.†But what is really out of control is tax breaks for billionaires.
We Can Cut Class Sizes in Half Just by Rolling Back Tax Breaks to 1996
In 1996, we had 400 tax breaks costing $20 billion. We now have more than 700 tax breaks for the rich costing our schools $30 billion. This includes the 1997 Intangible Property tax break that is so unfair and so costly that the Department of Revenue and the state legislature do not even want you to know about. It also includes most of the Boeing tax breaks and the Microsoft tax break.
So the question is what is more important? Helping Bill Gates and Paul Allen buy another private jet? Or helping one million students in Washington state get the education they need and deserve to succeed in school and succeed in life? If I am elected, I will file a motion for summary judgment immediately to declare every tax break passed since 1996 to be illegal, null and void and that the resulting $10 billion per year in additional state revenue be put in an account controlled by the Superintendent of Public Instruction. We could have full school funding restored in as little as 6 months.
You now know why class sizes in our state are the highest in the nation. The fact is I am the only candidate even talking about the real cause of our massive class sizes. All of the other candidates like to talk about their “great relationships” with the very bandits who are robbing our schools of funding and our kids of their future. They perpetuate the myth that some how the legislature will suddenly come clean and start funding our schools “next year.” But all that will come out of Olympia next year is the same thing that came out of Olympia this year and last year and the year before that – more excuses and more lies. Did you know that 4 years after the Supreme Court McCleary ruling, we have 30,000 more kids – but 1,000 fewer teachers? All we got since McCleary was another fake committee and another hundred tax breaks for the rich!
This is why we need completely new leadership, more honest leadership, in Olympia. This is exactly what I will provide – real solutions – not merely marketing slogans. I therefore hope you will share this important article with every teacher and parent you know. Together, we can win this election and give our kids the education they deserve.
Originally published at SpringForPublicSchools.org
