Why Teacher Salaries Have Fallen So Low During the Past 20 Years… and How to Restore Them
Some Seattle School District administrators and school board members have claimed that they do not have money to pay Seattle teachers fairly. In this article, we will look first at the decline in school funding in Washington state compared to the national average during the past 20 years. Second, we will review the related decline in buying power of teachers in Washington state during this same 20 year period. Third, we will compare Seattle School District spending to similar school districts in Washington state. Fourth, we will present some potential solutions to these related problems.
I. Two Decades of Decline in Washington State School Operating Funding Leads to $3 Billion Per Year Shortfall and the Highest Class Sizes in the Nation!
The most common mistake made in assessing the school funding crisis in Washington State is to look only at actual dollars spent on public schools. Using this misleading measure, it appears that school funding has gone up nearly every year during the past 20 years. Of course, this measure ignores the increasing number of students and the decreasing value of the dollar during the past 20 years. The second most common mistake is to look only at “Per Pupil†funding. This measure is better than absolute dollars. But it still ignores the rising cost of living from year to year and the dramatic differences in the cost of living from state to state. A far more accurate way to assess school funding from year to year or from state to state is to use State Spending as a Percent of State Income. How many cents out of every dollar of income is spent on public schools? Below is a graph of school funding in Washington state from 1997 to 2013 as a percent of income compared to national average school spending.
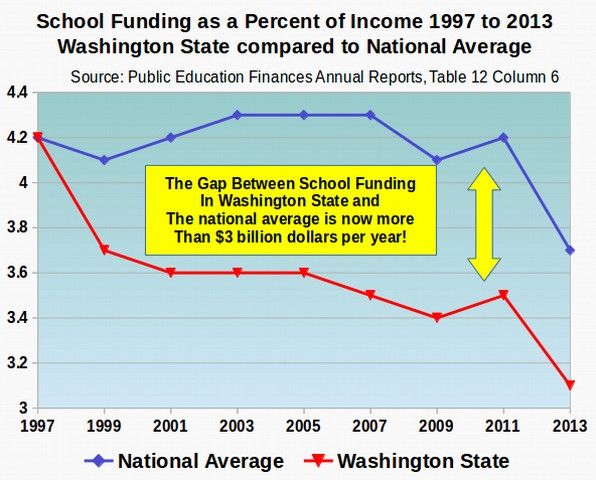
The last time Washington state was at the national average in school funding was 1997. Washington state school funding fell sharply between 1997 to 2003. School funding has fallen so low that it would take more than $3 billion per year just to restore school operation funding in our state to the national average.
We would need to hire more than 10,000 teachers just to restore class sizes in our state to the national average! Seen as a percent of income, the 2015 legislature’s “increase†in school spending of $600 million per year does not even restore school funding to what it was in 2011 – much less restore school funding to the national average. http://nces.ed.gov/surveys/sass/tables/sass1112_2013314_t1s_007.asp
WhyActual Class Sizes are Much Larger Than Student to Teacher Ratios
The most common mistake made when discussing class size is to confuse class sizes with Student to Teacher Ratios. The Student to Teacher Ratio is determined by dividing the total number of students in a school or a state by the total number of staff at the school or the state. For example, if you go to the Washington State OSPI website and click on Apportionment, then Publications, then Personnel Summary Reports, then select a year, then click on Table 46, you will get a report called “Ratio of Students to Classrooms.†This is the Student to Teacher Ratio. For the 2014 school year, this ratio was 18.2 students per teacher. http://k12.wa.us/safs/PUB/PER/1415/tbl46.pdf
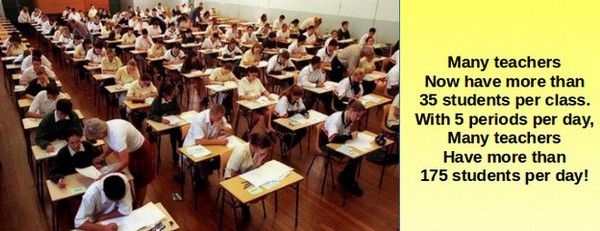
A better estimate of class sizes comes from a national survey of classroom teachers in which teachers are asked how many students are in their average classroom. This survey indicates that for Grades 1 through 6, the national average class size is 21 students and the average class size in Washington state is 24 students. For Grades 7 through 12, the national average class size is 27 students and the average class size in Washington state is 30 students. http://nces.ed.gov/programs/digest/d13/tables/dt13_209.30.asp
Here is a distribution of class sizes showing which states have low, average, above average or extremely high class sizes:
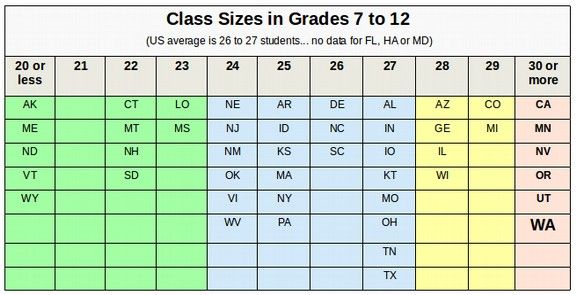
However, even this survey of teachers under-reports the actual class sizes in the nation and in Washington state because it includes Special Education teachers who often have classes of under 10 students. Excluding Special Education classes, the typical or median class size in the US is likely close to 29 students and in Washington state, it is likely close to 32 students. If the Class Size Initiative 1351 were fully funded, it would lower class sizes in Washington state down to 17 students in elementary school and 25 students in high school.
II. The Decline in Buying Power of Washington Teachers During the Past 20 Years… The Cost of Living Adjustments (COLAS) suspended by legislature now cost Washington teachers $2 billion per year
Closely related to Washington state school funding, the actual buying power of teachers in Washington state has been declining for over 20 years. This is due to the fact that since the 1990s, the State legislature has consistently failed to provide teachers with “Cost of Living Adjustments†more commonly called COLAs. For example, in the 1990’s, the Cost of Living increased about 15% but teacher salaries did not rise at all in Washington state. This meant that teachers took about a 15% real pay cut in the 1990s.
As a consequence, the teachers union and others sponsored Initiative 732 in 2000 which was approved by the voters with a margin of 63% to 37%. This Initiative required the State legislature to provide teachers with COLAs. Sadly, the State legislature suspended Initiative 732 and failed to provide teachers with COLAs for 8 out of the next 14 years. This was the equivalent of another 16% pay cut. Thus, teacher salaries have seen about a 30% pay cut in the past 20 years in terms of real purchasing power.
In 2009, the State legislature commissioned a report to determine how much it would cost to restore teachers salaries in Washington state to a level similar to other West Coast states such as Oregon and California. On June 30, 2012, the Compensation Commission issued its final 170 page report. The Commission recommended raising the starting salary for teachers in Washington state from $33,400 to $48,700. The Commission also recommended raising the pay of all other teachers by more than $5,000 per year in part to make up for the lack of COLAs during the previous 20 years. The total cost of these recommendations exceeds $2 billion per year. The legislature has failed to act on these recommendations ever since. http://www.k12.wa.us/Compensation/CompTechWorkGroupReport/CompTechWorkGroup.pdf
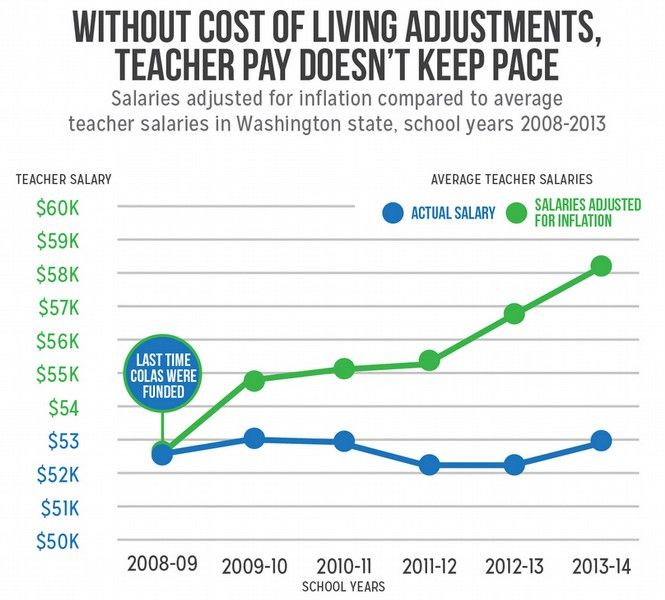
Here is a chart showing that the average teacher salary in Washington state has lost more than $5,000 in purchasing power just since 2008 (which was the last time teachers were given even a modest COLA). http://budgetandpolicy.org/schmudget/teachers-lose-in-the-final-budget
Since our State revenue is billions of dollars lower than the national average, our problem is not out of control State spending, but out of control State tax breaks for millionaires. In shifting the tax burden to our middle class homeowners, and causing the firing of thousands of public servants, these massive tax exemptions for the rich do not create jobs. Instead, they cost jobs.
We do not have an “out of control†State spending problem… We have an “out of control†tax breaks for billionaires problem.
III. Seattle School District Spending Compared to Similar School Districts in Washington State and the Nation
The most detailed and objective comparison of Seattle School District spending compared to other similar school districts in Washington state was published by the Washington State Auditor on June 6 2012. http://www.sao.wa.gov/state/Documents/PA_K12_Education_Spending_ar1007826.pdf
The 2012 Auditor study found that while some states spent up to 69% of revenue on classrooms, Washington state only spent 60% of revenue on classrooms.
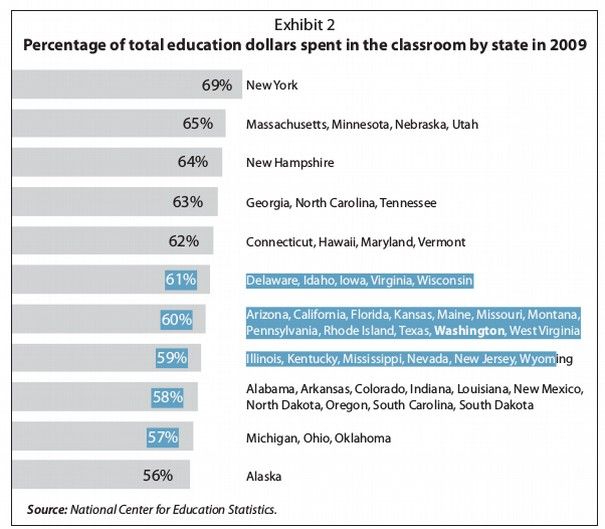
The study also found that OSPI’s annual Report Card greatly overstated the amount Washington School Districts spend on teaching: “NCES data shows that Washington spent 60.2 percent of its education dollars on classroom instruction in 2009. OSPI’s annual Report Card for that year shows that it spent nearly 70 percent on “teaching.†In its Financial Reporting Summary, OSPI separately reports expenditures related to teaching (classroom instruction) and activities it categorizes as teaching support (curriculum development, student safety, nurses, counselors, etc.). For 2009, those figures were: Teaching – 61.4 percent, Teaching support – 8.6 percent. In its annual Report Card, however, OSPI combines those two categories and reports them under the heading “teaching.†Because the combined figure includes spending for nurses, counselors, student safety, and the like, it overstates the percentage of Washington’s education dollars that is spent in the classroom.
How the Seattle School District spending on teaching compares to other similar school districts
This 2012 State Auditor study grouped school districts into comparison cohorts based on size. The Seattle School District was grouped in Peer Group 37 with 6 other very large school districts in Washington state all with more than 20,000 students. These 6 other school districts were Evergreen, Federal Way, Kent, Spokane, Tacoma and Vancouver. The 2012 report found that, as a percent of total spending, the Seattle School District spent MUCH LESS on teaching than any other comparable school district in Washington State. At the same time, the Seattle School District spent MUCH MORE than any other comparable school district on Central Office Administration.
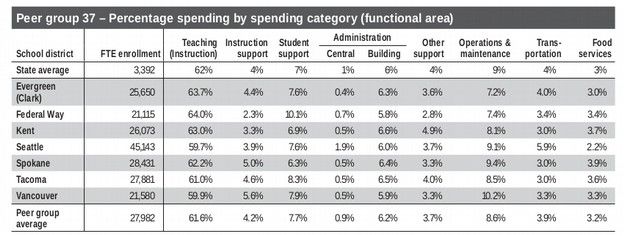
For example, while Federal Way spent 64% of their budget on teachers and less than 1% on Central Office Administration, the Seattle School District spent less than 60% of teachers and nearly 2% on Central Office Administration. The State Auditor recommended that Washington School Districts spend more on teachers and less on central administration. This advice was directed in particular at the Seattle School District – which appears to spend more on central administration than almost any large school district in the nation.
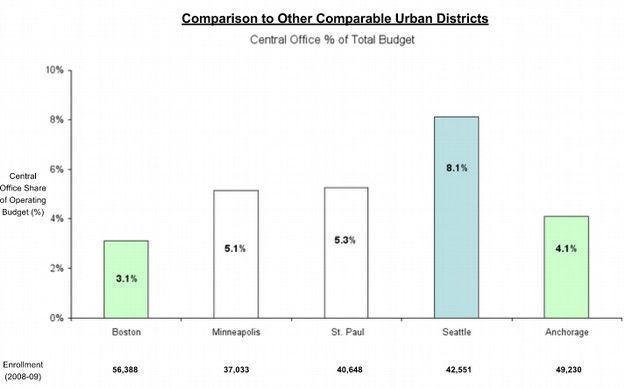
On October 7, 2009, a Seattle School District parent, Meg Diaz, issued a report which also showed that the Seattle School District had the highest administrative overhead of any school district in Washington state. This study also found that the Seattle School District had a much higher Central Administration burden compared to other large school districts from around the nation. https://docs.google.com/presentation/d/1zodBLaj3dWyKNew5vR2P-qm87yfozqCv86OEUXDjbDU/present?slide=id.i0
Obviously, the Seattle School District has a problem of spending too much on Central Administration and not enough on teachers. But the real problem is that the Washington State legislature is under funding public schools in our state by about $3 billion per year compared to the national average. The only real way to restore teacher salaries in Washington State is to organize teachers to support a bill that will provide $3 billion per year in increased State Revenue.
In the 2015 legislative session, only one bill was submitted which would actually restore school funding in Washington state to the national average. That bill was Senate Bill 6093, sponsored by Senators Chase and McAuliffe. Teachers should thus look more closely at and organize support for that bill.
IV. Senate Bill 6093… A Simple Solution to the School Funding Crisis
The most reliable way to achieve a fair tax structure is to tax the wealth of the very rich by repealing a 1997 tax exemption which currently exempts the wealthy from paying their fair share of state property taxes. Senate Bill 6093, the School Funding Through Tax Fairness Act, sponsored by Senators Chase and McAuliffe, would provide an additional $3 billion per year to restore school funding and lower class sizes in our state to the national average and more than one billion per year to restore school construction funding. By comparison, the 2015 budget providesonly $700 million in additional school funding and less than $300 million in school construction funding. Senate Bill 6093 would place a referendum before the voters asking to repeal the current exemption on intangible property from the State property tax and tax intangible property at the same one percent rate as tangible property. Retirement accounts and personal intangible property up to $200,000 not in retirement accounts would be exempt. So closing this tax loop hole would only increase taxes for the top 5% of our wealthiest citizens. The other 95% would see a reduction in their State taxes of as much as four thousand dollars per year!Repealing this tax break for the rich would not harm billionaires because they could still deduct their state taxes from their federal taxes.
Comparing Senate Bill 6093 to the 2015 Band-aid Budget
Here is a table comparing Senate Bill 6093 to the State Budget passed in July 2015.
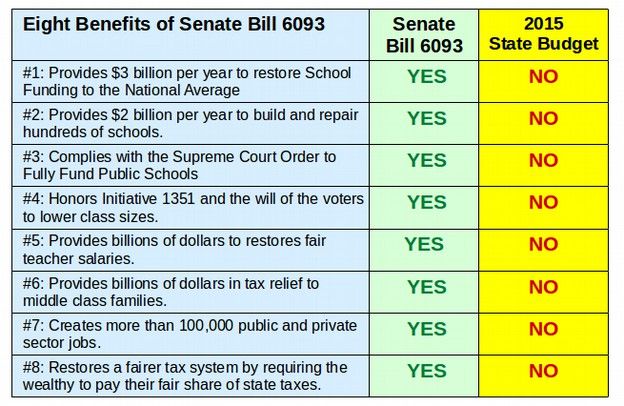
Senate Bill 6093 is the only bill introduced in the 2015 State legislature that addresses the concerns of our Supreme Court and fully funds the Class Size Initiative 1351. Senate Bill 6093 also provides billions of dollars for building schools to address the school construction shortfall. It also creates more than one hundred thousand urgently needed public and private sector jobs to restore economic prosperity here in Washington state. Equally important, it accomplishes these goals without raising taxes on our poor or middle class. Instead, it restores a fairer more stable tax system by requiring the wealthy to pay their fair share of state taxes. Here is a link to Senate Bill 6093 so you can read it for yourself:
http://lawfilesext.leg.wa.gov/biennium/2015-16/Pdf/Bills/Senate%20Bills/6093.pdf
When did the drop in school funding occur?
We have not always had the lowest school funding in the nation. In 1997, Washington was near the national average in school funding. Something happened in 1997 to cause a huge plunge in state revenue and school funding. Where did all of the money go? One important clue is looking at when the sharp decline in school funding occurred. It turns out that there was a sharp decline in both school funding and state revenue that began in 1997. After some research on various large state tax breaks, it turns out that in 1997, the state legislature passed Senate Bill 5286 exempting all intangible property from our state property tax. Currently, our state taxes tangible property, such as houses, at a rate of one percent a year. By contrast, thanks to the 1997 tax break, intangible property, such as stocks and bonds, are not taxed at all.
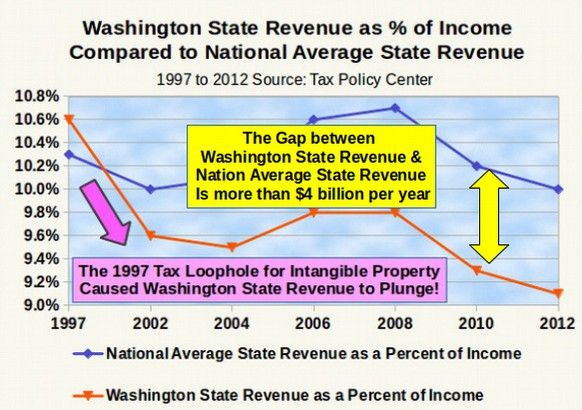
While national average state revenue remained above 10% of income, state revenue in Washington state has fallen to only 9% of income. This does not sound like much of a difference – but it comes to a loss of more than $3 billion in revenue per year!http://www.taxpolicycenter.org/taxfacts/Content/PDF/dqs_table_77.pdf
Concentration of Wealth in Washington State
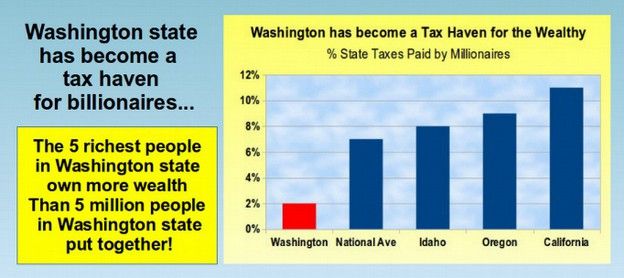
Shockingly, as bad as wealth concentration is in the rest of the nation, it is even worse here in Washington state. The bottom 70% of our population – or 5 million people – own just 10% of the wealth. 57% of the wealth goes to the top five percent. But an amazing10% of all wealth in Washington state is owned by just five billionaires: Bill Gates, Jeff Bezos, Steve Ballmer, Paul Allen and Howard Schultz . Put another way, the these five richest people in Washington state own more wealth than five million people in Washington state put together. http://www.ofm.wa.gov/reports/income_wealth_report.pdf
Washington has become a Tax Haven for Billionaires
We are the only West Coast State where millionaires do not pay their fair share of state taxes. If millionaires in our State paid their fair share in State taxes, it would raise total State revenue by more than $6 billion per year. Half of this could go towards restoring school funding in our State to the national average, and the other half could go towards restoring school construction funding and other important State services to the national average.
Instead of funding schools, our current leaders give billions in tax breaks to billionaires and wealthy multinational corporations – at the same time that they tell us there is not enough money to hire teachers or build schools. As a consequence, our children are forced to endure some of the lowest funded and most over-crowded schools in the nation. Total annual tax breaks are currently $30 billion per year.
Conclusion… A Simple Solution to the School Funding Problem
Given that the current legislature continues to ignore the Supreme Court and ignore the will of the voters by continuing to kick the school funding can down the road, now is the time to begin a public discussion over the best way to balance the State budget while still protecting the future of our children and our communities. Funding our public schools should be more important than protecting tax breaks for billionaires. We hope parents and teachers will help us get this bill on the ballot. With the serious nature of our current school funding crisis, it is time to put all options on the table and begin a public discussion over the future of our schools and our State.
Senate Bill 6093 would also pump $3 billion per year back into our local economy creating more than 100,000 jobs in our State! Repealing the Intangible Property Tax Exemption is the best way to restore national average school funding without raising taxes on our middle class. It also has the benefit of not being a new tax. It is merely repealing an unwise and unfair tax exemption. For more information about the benefits of Senate Bill 6093, visit our website: Coalition to Protect our Public Schools.org
Originally published at Coalition to Protect our Public Schools
